Phase 2: Building the Analytical Framework
After exploring the data, I developed a scoring methodology that fairly compares BD-Sales pairings while accounting for inherent lead quality differences. This phase defines the metrics, establishes baseline comparisons, and classifies performance.
Step 1: Metric Selection
After evaluating multiple candidates, four key metrics were selected for analysis
Selection Criteria
Metrics needed to be: (1) Actionable - can we change behavior?, (2) Measurable - reliable calculation from data, (3) Impactful - correlates with revenue, and (4) Independent - provides unique information
1. Win Rate (25% weight)
Definition: % of decided opportunities (Won or Lost) that closed won
Why included: Direct measure of conversion success
2. Early Death Rate (25% weight)
Definition: % of lost opportunities that died within 14 days
Why included: Indicates lead qualification quality (lower is better)
3. Stale Pipeline Rate (25% weight)
Definition: % of open deals inactive for 90+ days
Why included: Measures deal momentum and pipeline health (lower is better)
4. Average Deal Size (25% weight)
Definition: Mean deal value across all opportunities
Why included: Revenue impact per opportunity (higher is better)
Step 2: BD Baseline Methodology
The critical decision: How do we fairly compare pairings when different BDs pass different quality leads?
🎯 Key Insight: BD Baseline Comparison
Each BD-Sales pair is compared to THAT BD's average performance (not the company-wide average).
Why this matters: Different BDs pass different quality/difficulty leads. Enterprise BDs naturally have lower win rates than SMB BDs. Comparing to BD's baseline controls for this, making comparisons fair.
Example:
- BD_003 (Enterprise) average: 18% win rate
- BD_003 → SR_007: 25% win rate
- Percentage deviation: (25-18)/18 × 100 = +38.9%
- Interpretation: "SR_007 performs 39% BETTER than expected with BD_003's difficult leads"
How BD Baseline Normalizes for Quality
- Calculate each BD's average across all metrics (win rate, early death, stale pipeline, deal size)
- Compare each pair to THEIR BD's average using percentage deviation: ((Pair - BD Avg) / BD Avg) × 100
- Apply directionality: Early Death and Stale Pipeline are inverted (lower is better)
- Weight equally: Each metric contributes 25% to final score
- Apply confidence multiplier: Based on opportunity count (full confidence at 7+ opps)
Why Percentage Deviation = Normalization
Percentage deviation accounts for baseline difficulty. A Sales Rep who performs +30% above baseline is impressive whether that baseline is 18% (hard leads) or 32% (easy leads). The percentage normalizes for difficulty level, making scores comparable across different BD lead sources.
Step 3: Two-Level Classification System
Scores are used at TWO different levels for different purposes
🎯 Understanding the Two Levels
LEVEL 1: BD-Specific Rankings (For Routing)
- Purpose: Make routing decisions for each BD's leads
- Method: Rank ALL pairs within each BD, identify top 5 and bottom 5
- Output: "Route BD_003's leads to SR_014, SR_006, SR_011..." (actionable routing rules)
- Use case: Operational - which sales rep should get this lead?
LEVEL 2: Population Classification (For Context)
- Purpose: Understand overall pairing quality across company
- Method: Calculate percentiles across ALL pairs (after normalization)
- Output: "High Performer" (75th percentile+), "At-Risk" (10th percentile-), etc.
- Use case: Strategic - which BDs have stronger pairing options overall?
Percentile-Based Classification Thresholds
- High Performer: ≥ 75th percentile (top 25% of all pairs)
- Above Average: 50th - 75th percentile
- Average: 25th - 50th percentile
- Below Average: 10th - 25th percentile
- At-Risk: < 10th percentile (bottom 10%)
Why percentiles? Data-driven (not arbitrary), adaptive to score distribution, and easily explainable to stakeholders.
Performance Score Distribution
After normalization and weighting, how do pairings score?
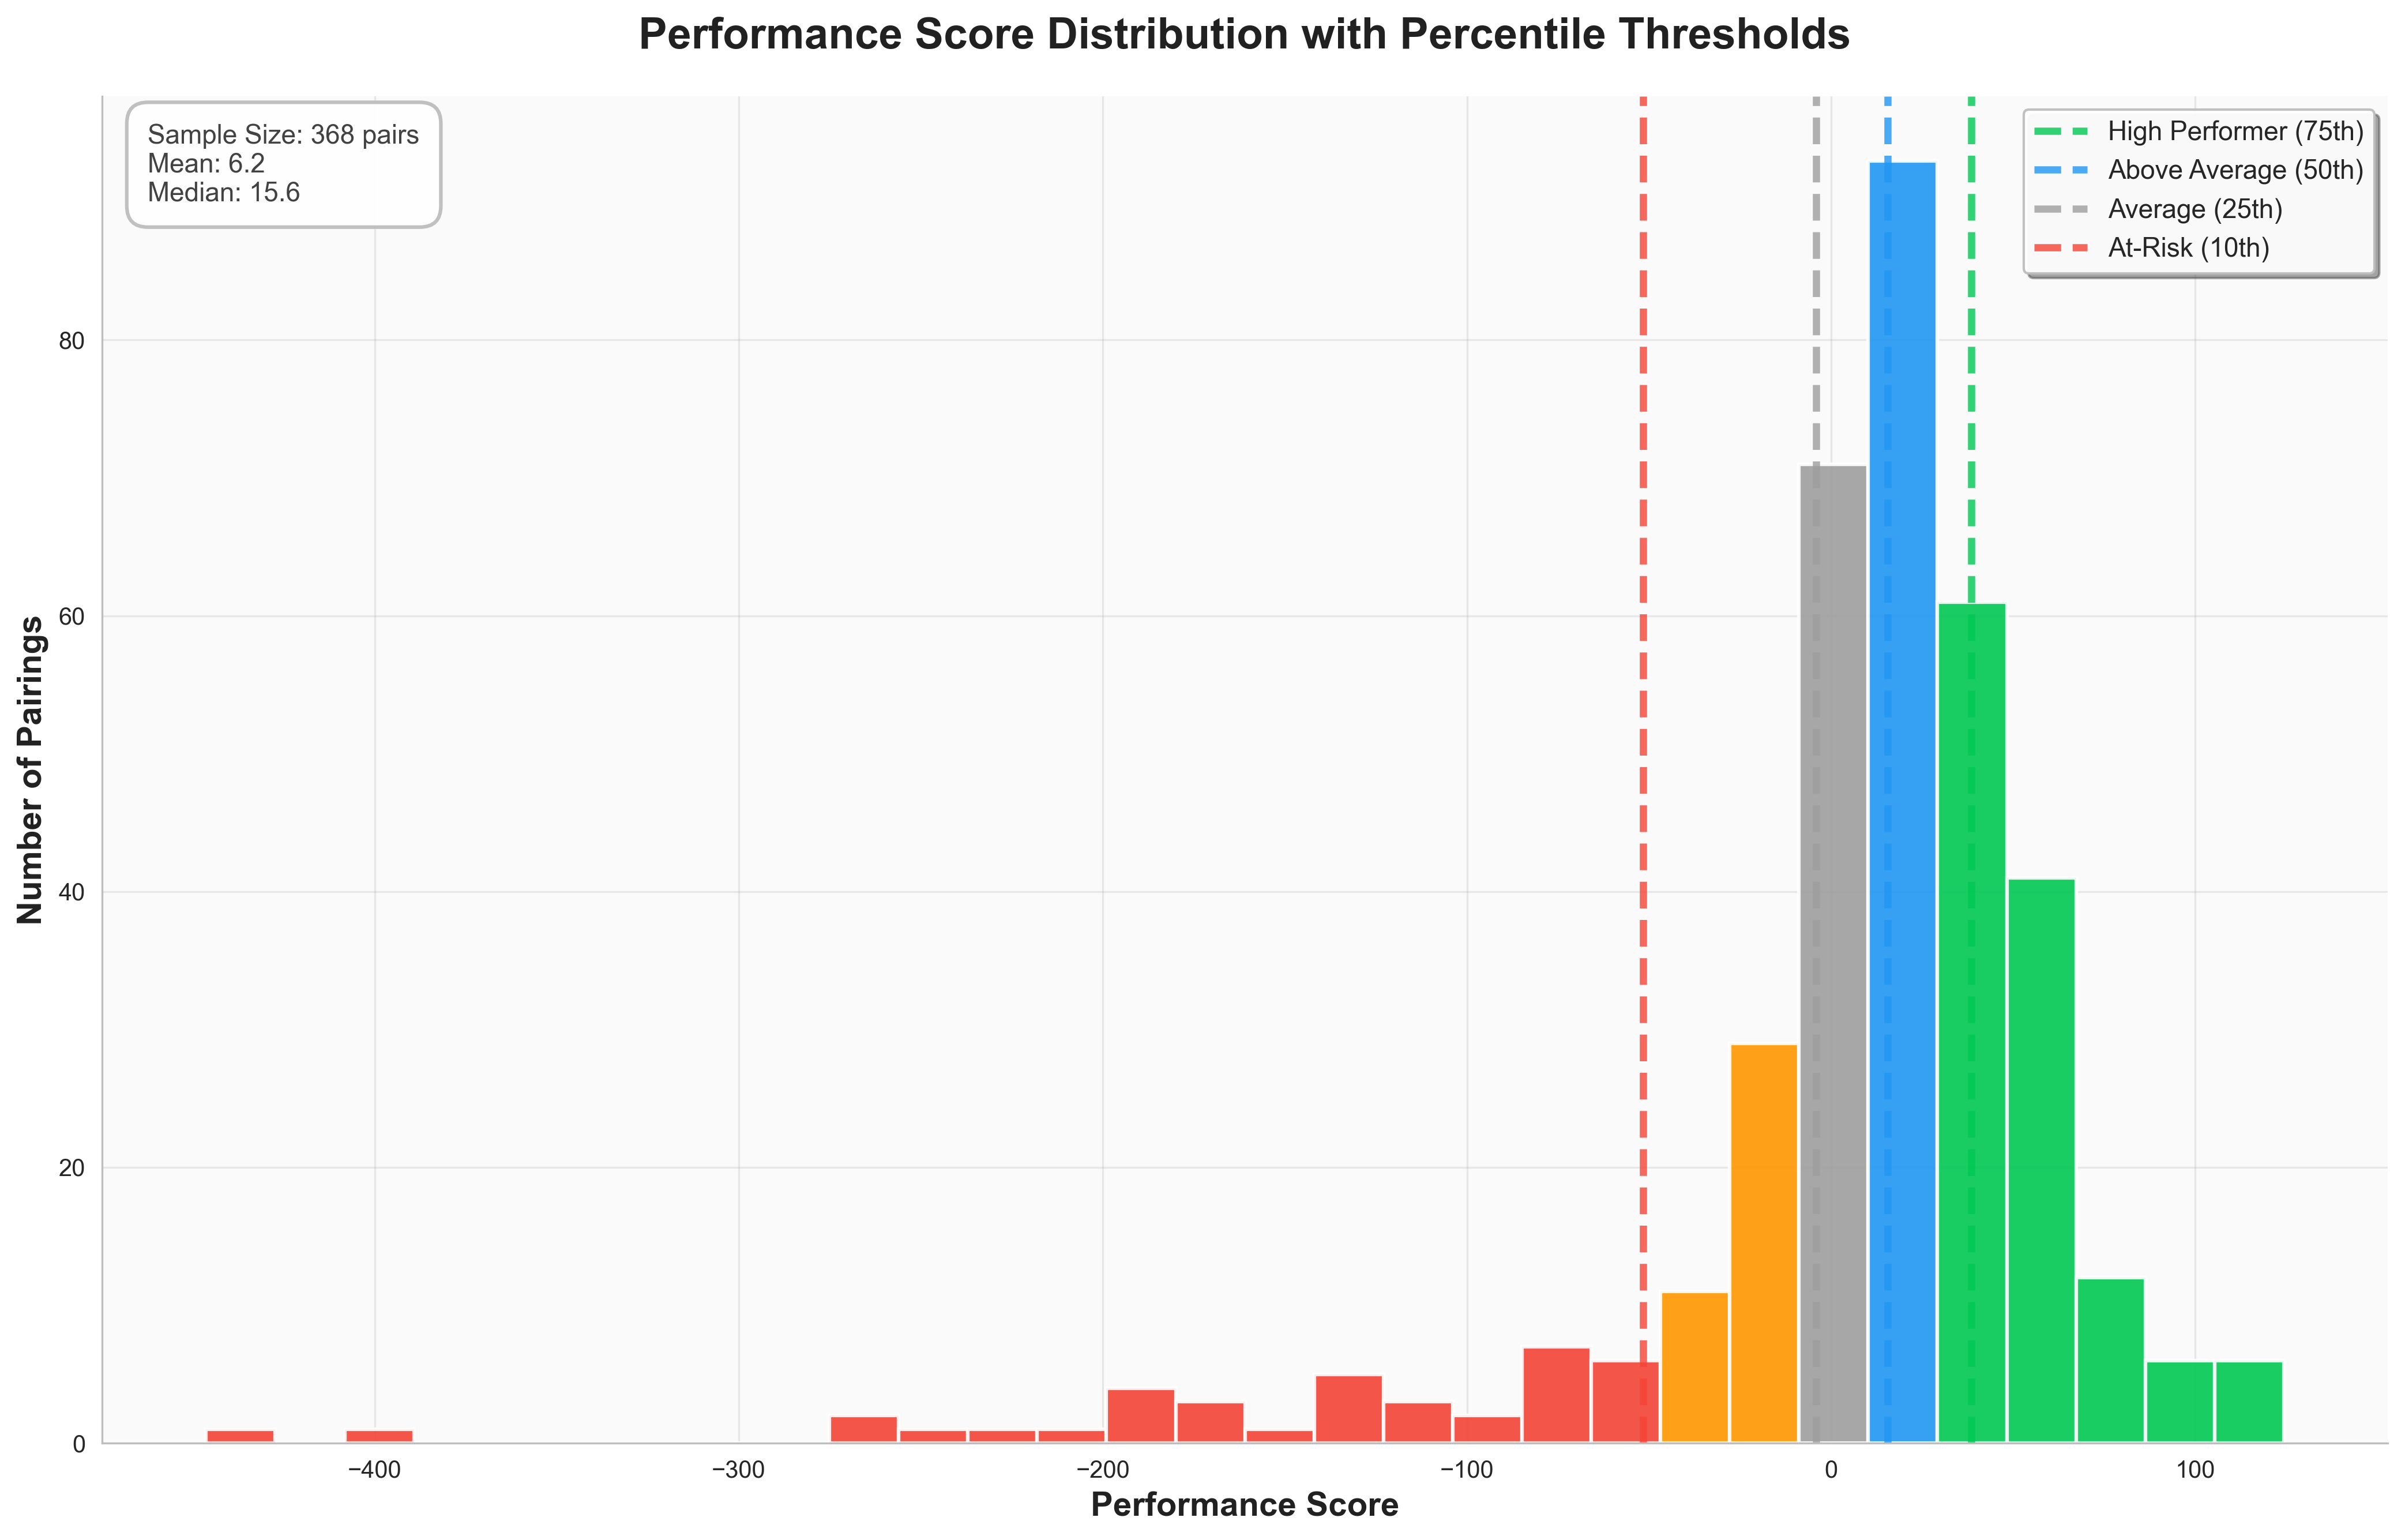
Key Insights
- Clear separation between high performers (75th+ percentile) and at-risk pairs (10th- percentile)
- Normal distribution indicates healthy performance variance (not all pairs identical)
- Percentile thresholds create objective classification zones (data-driven, not arbitrary)
- Population classification shows overall quality after controlling for BD lead difficulty
Top Performers vs At-Risk Pairs
Identifying the best and worst BD-Sales combinations
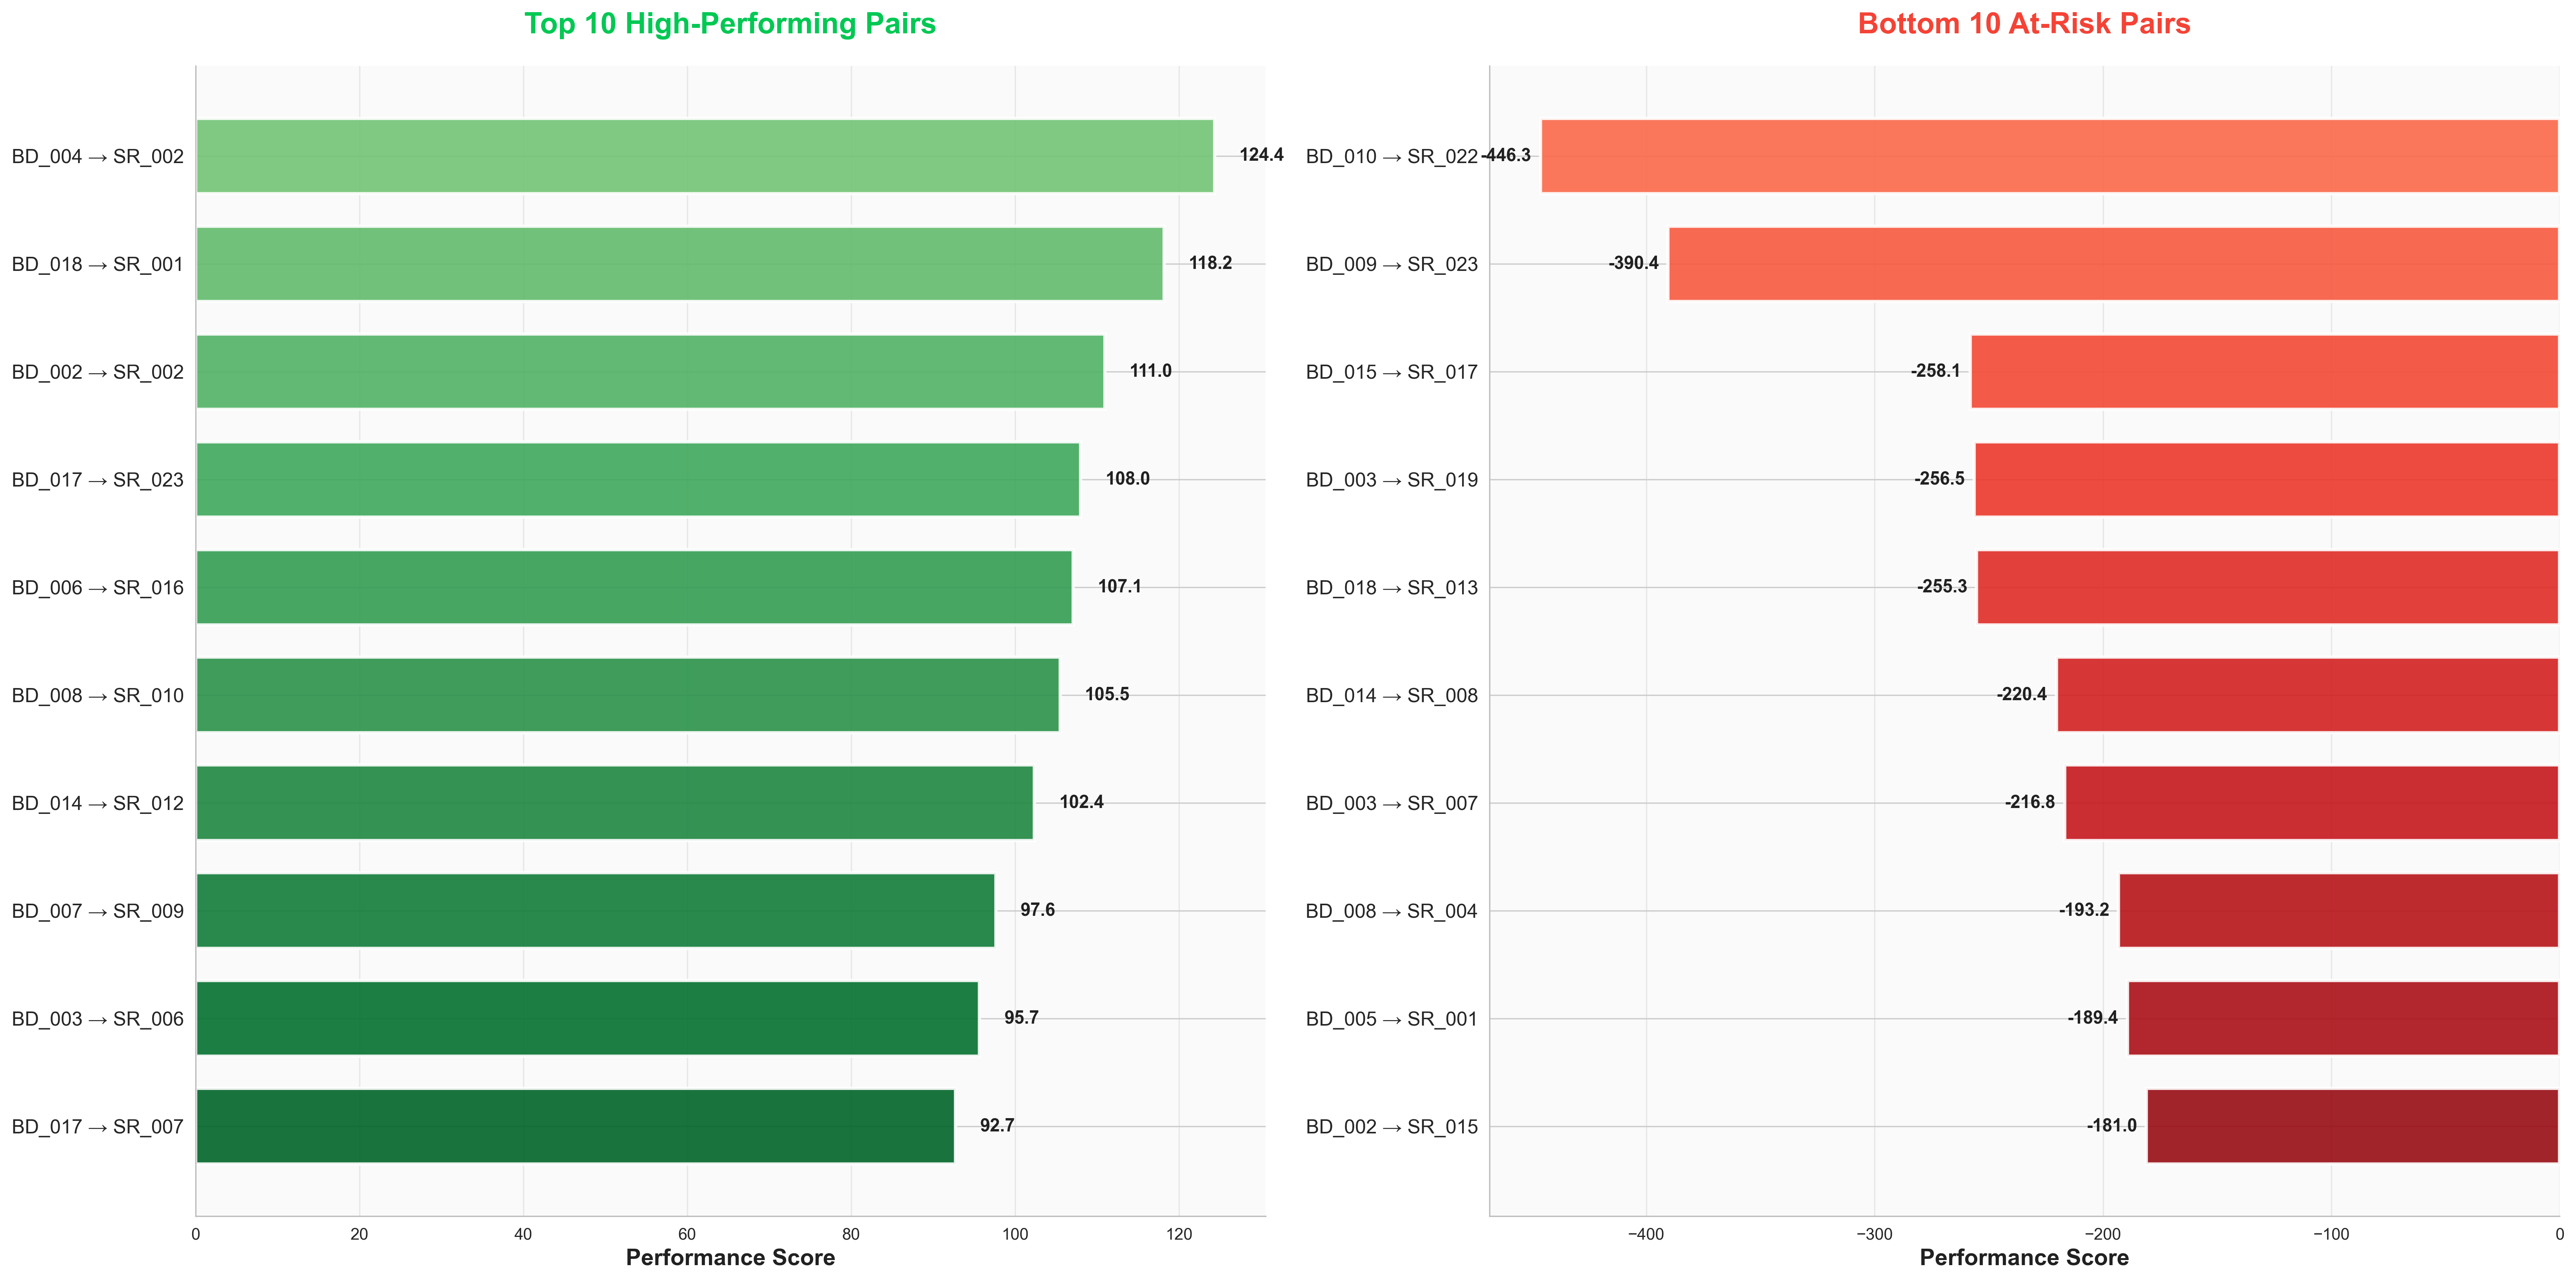
Key Insights
- Performance range spans 100+ points: Clear difference between optimal and poor pairings
- Top performers consistently score 40+: Strong pairing chemistry across multiple metrics
- At-risk pairs score -60 or lower: Fundamental misalignment across metrics
- These represent population classification: Best/worst relative to ALL pairs after normalization
Performance Heatmap: Complete Pairing Matrix
Visual overview of all BD-Sales combinations
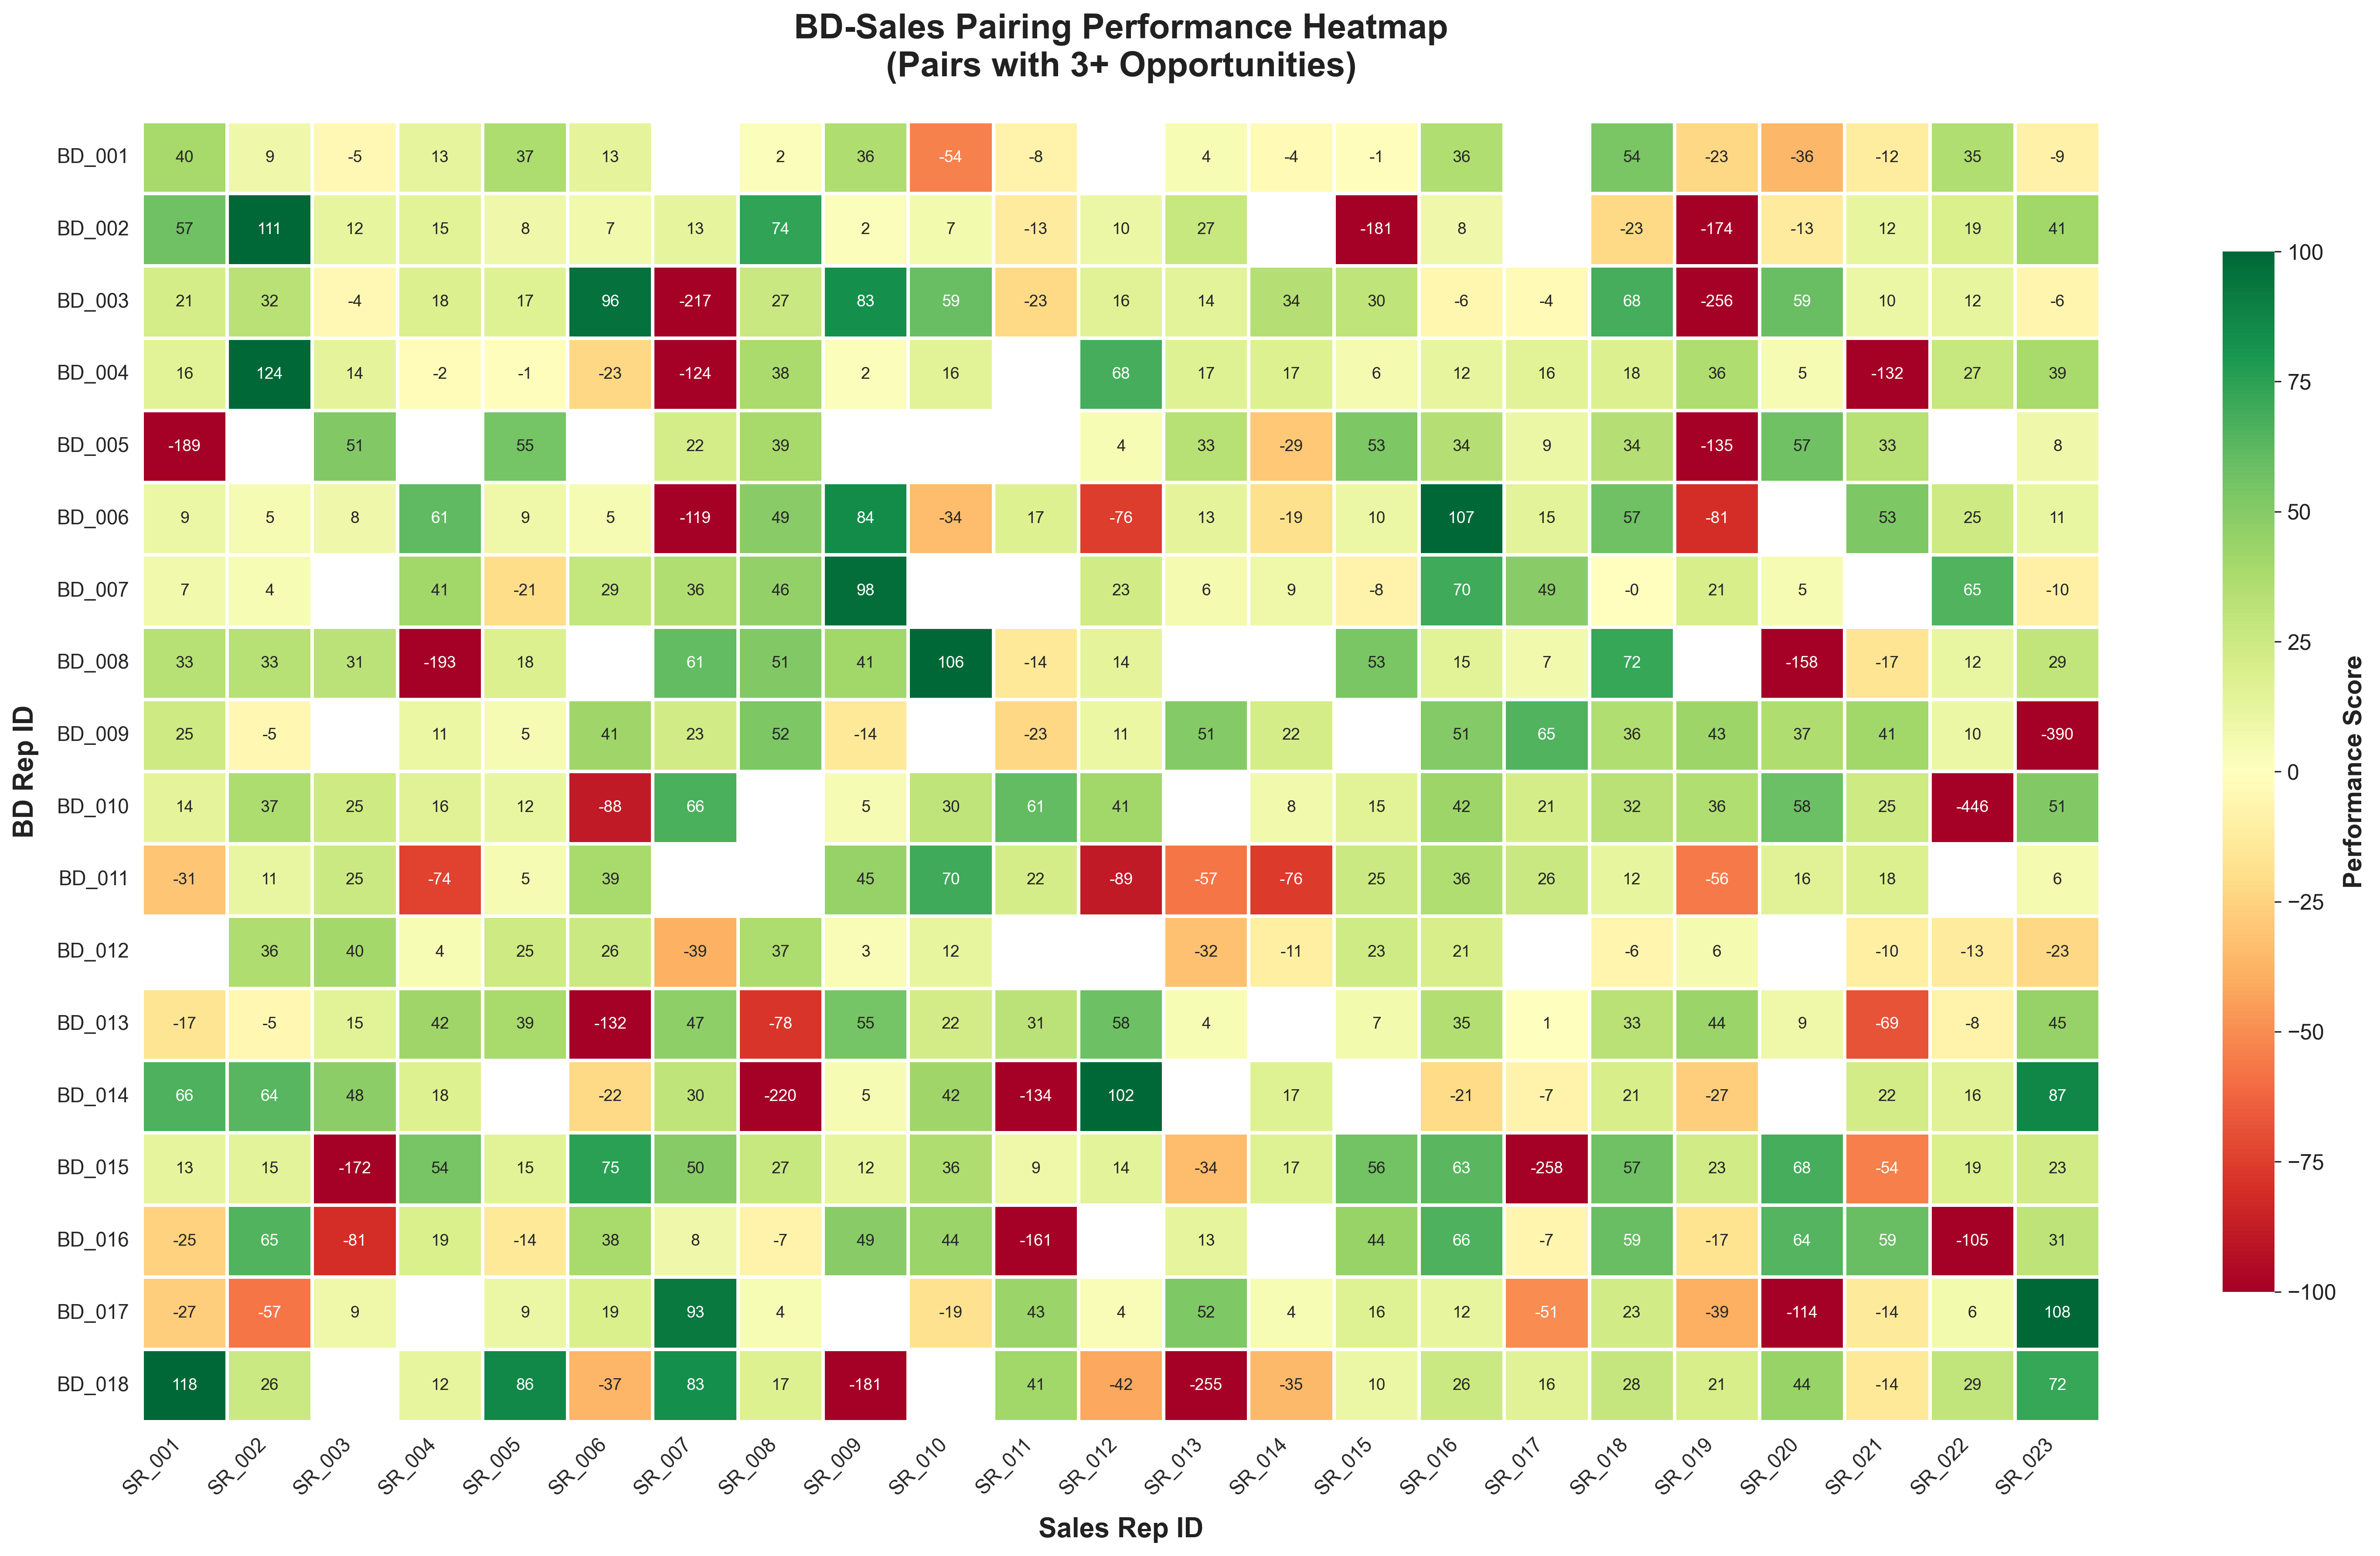
Key Insights
- Visual patterns emerge: Some BDs have strong performance across multiple Sales Reps (green columns)
- Universal closers identified: Some Sales Reps show consistent positive performance across many BDs
- Specialist patterns: Some Sales Reps excel with specific BDs but struggle with others
- Gaps reveal opportunities: Red zones highlight where alternative routing is critical
What Drives Performance?
Metric contribution analysis: High Performers vs At-Risk Pairs
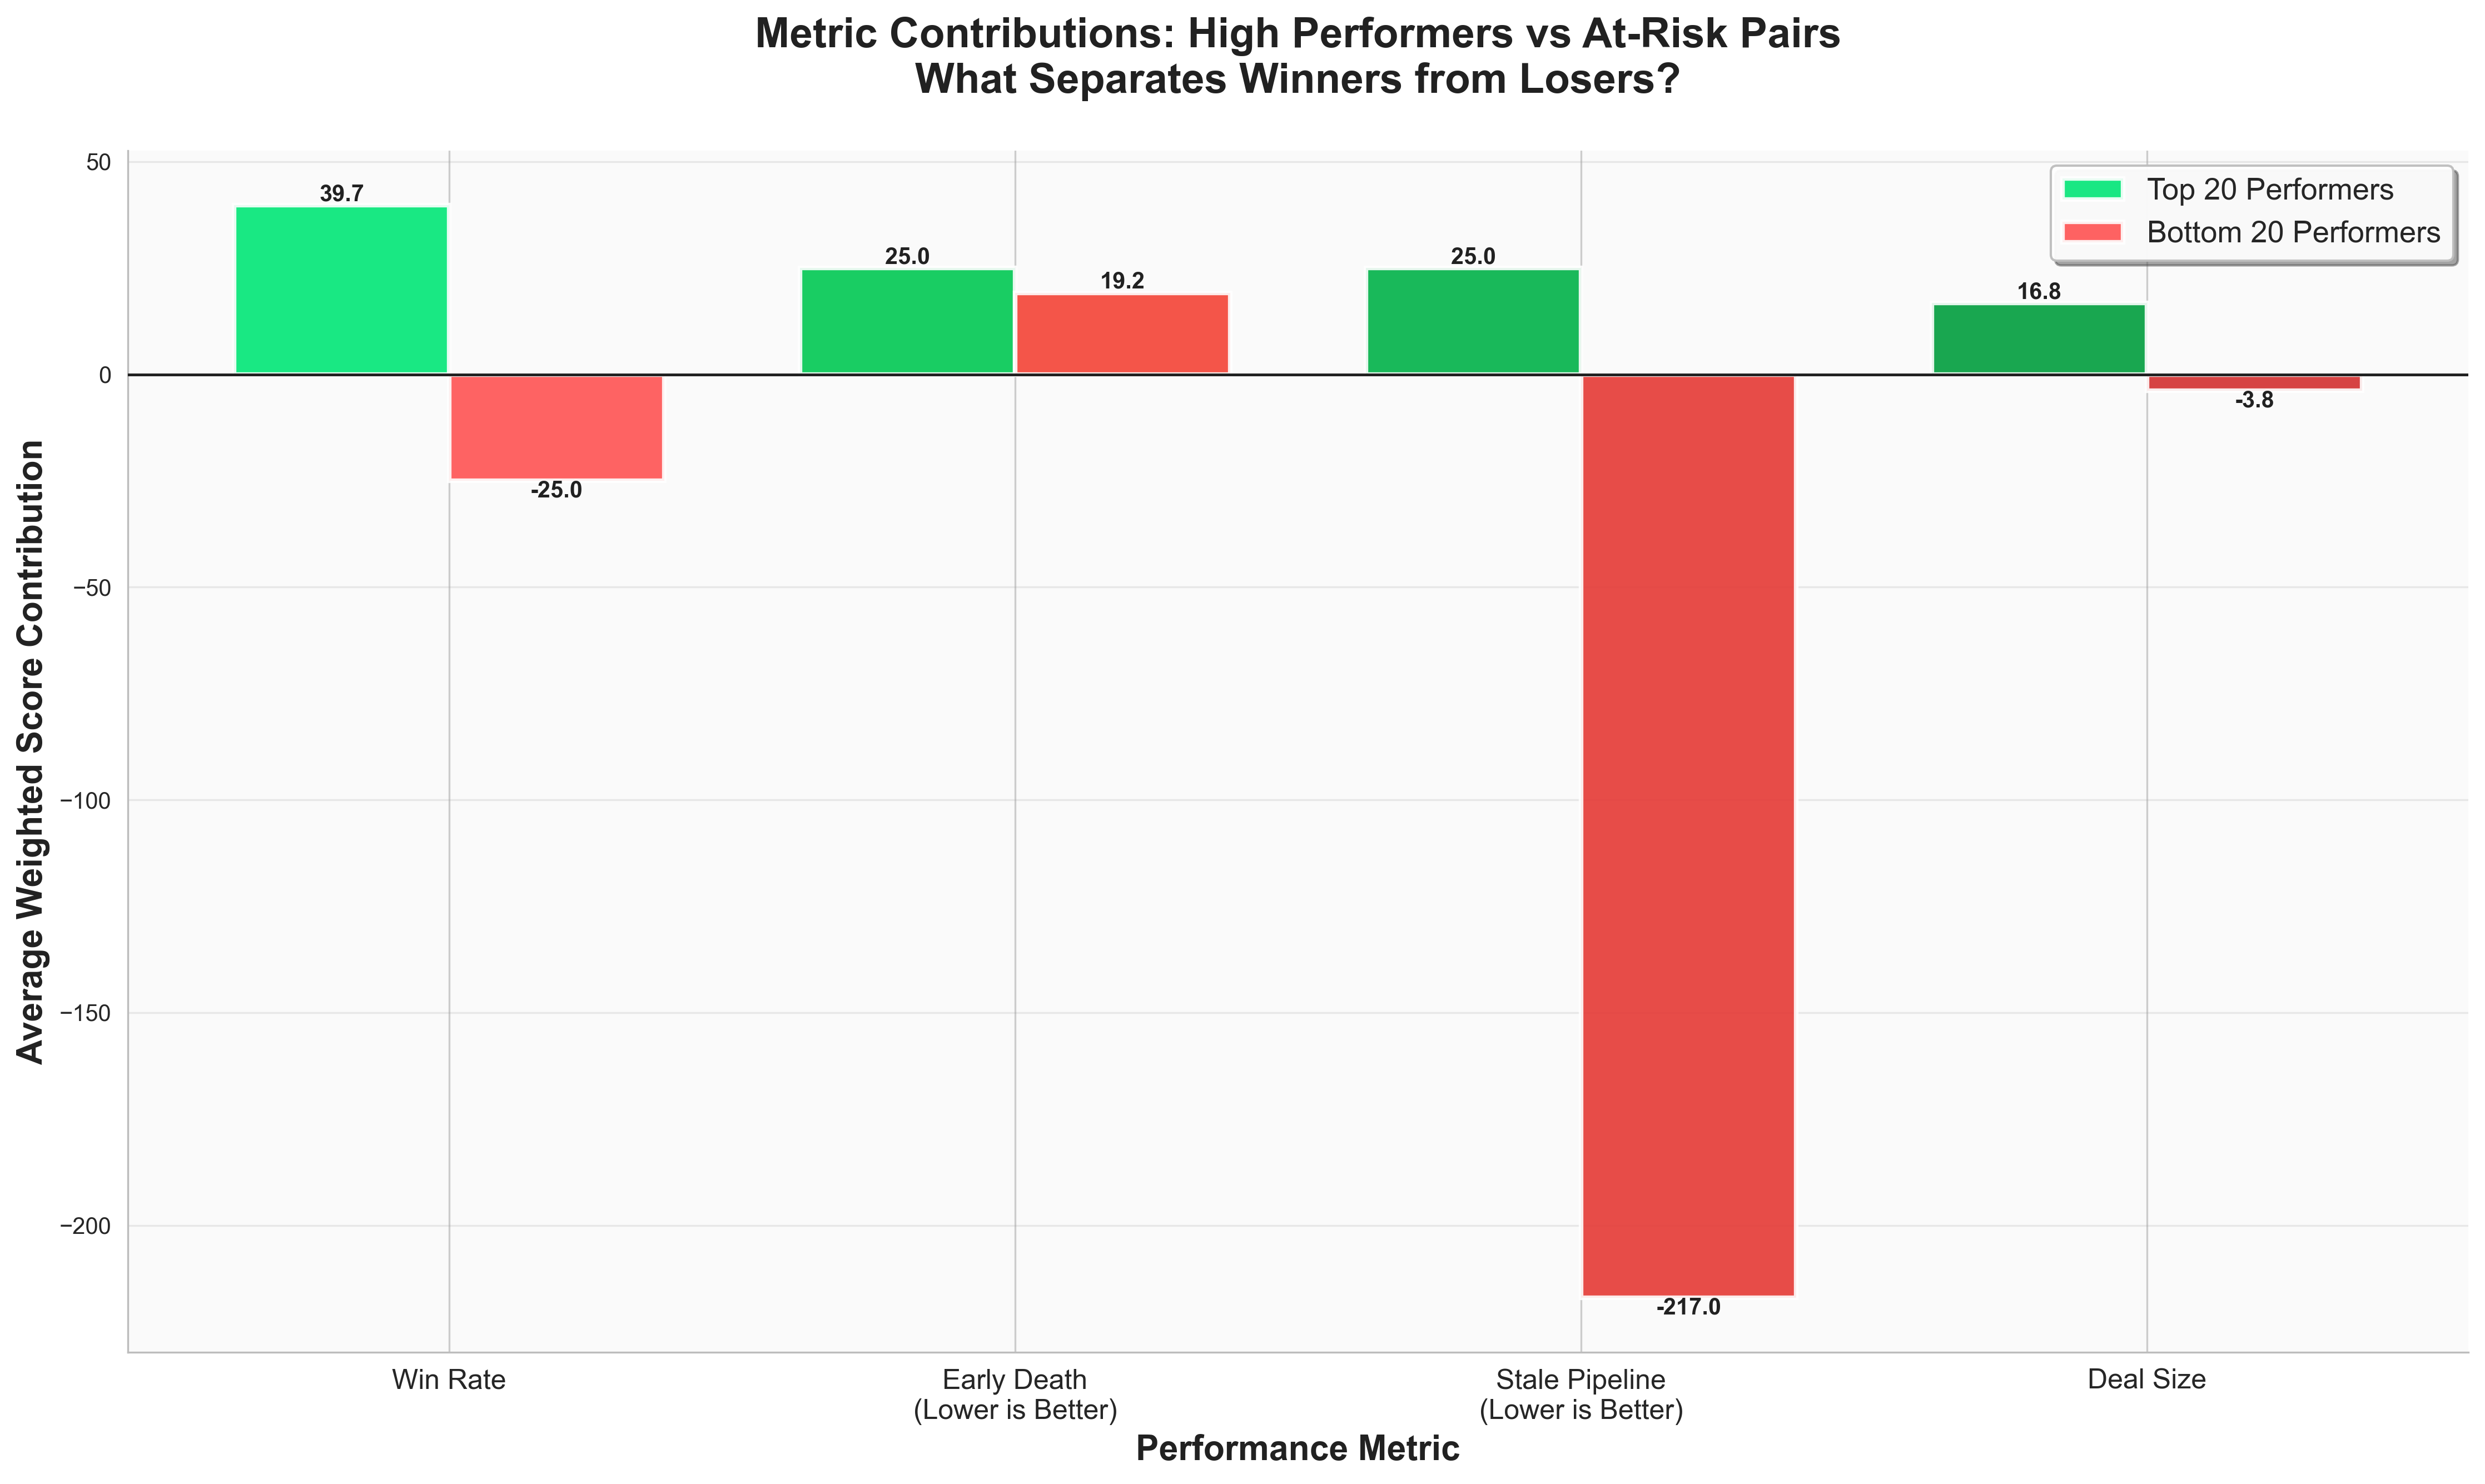
Key Discovery: Stale Pipeline is the Biggest Differentiator
- Stale Pipeline Rate: Largest gap between high performers and at-risk pairs (~30 points)
- Win Rate & Early Death: Also show significant separation (~20-25 points each)
- Deal Size: Smaller variance, indicating BDs pass similar-value opportunities regardless of pairing
- Business insight: Success isn't just about closing or not closing - it's about keeping deals MOVING. High performers maintain momentum and avoid stagnation.
Surprising Finding
I initially expected Win Rate to be the primary differentiator. However, Stale Pipeline Rate showed the largest separation. This suggests that training and coaching should focus on deal momentum management, not just closing techniques. High-performing pairs keep deals progressing decisively rather than letting them languish.
Methodology Summary
The complete analytical framework
✓ Four Key Metrics Selected: Win Rate, Early Death, Stale Pipeline, Deal Size (25% each)
✓ BD Baseline Comparison: Controls for lead quality differences across BDs
✓ Percentage Deviation Scoring: Normalizes for difficulty, makes scores comparable
✓ Confidence Multiplier Applied: Accounts for sample size reliability
✓ Two-Level Classification: BD-specific for routing + Population for context
→ Ready for Business Recommendations (Dashboard 3)